
A Business Student’s Guide to Excel for Beginners | Workshop Recap

The ARBUS Society held their first event of the Winter 2023 term on February 2, 2023. The society welcomed Daria, a 4B Math and Business student for a workshop on Excel, which is a widely and commonly used tool for data and statistical analysis in various job industries. In case you couldn’t make the event, or you need a refresher, below is a beginner's guide to Excel and a few helpful tips.
Basic Terminology

Active cell: Indicates which cell you are on
Column: Indicated by a letters
Row: Indicated by numbers
Fill handle: This assists with copying one cell to another without needing to manually copy and paste
Address bar: This is the selected cell address according to the grid (column letter, row number)
Formula bar: This bar will display the formula you are inputting
Title bar: Where the title of the workbook is displayed
File menu: Consists of helping to save or print your workbook
Quick access toolbar: This provides easier access to often used buttons such as save and print and is customizable
Ribbon tab: Command bar that organizes all of Excel’s features
Worksheet tab: Allows you to keep track of multiple worksheets in a workbook
Status bar: Displays various information about a worksheet such as the sum, average, amount of cells selected, etc.
Worksheet: Each full grid is considered a worksheet
Workbook: The combination of all worksheets together
Simple Formulas
When using any formula in Excel, you must always start with an “=” in the formula bar in order for the formula to be entered into the cell. Some basic formulas to help get you started with Excel are:
Adding:
= A1+ A2
Subtracting:
= A1- A2
Multiplying: (* is used as a multiplication sign)
= A1* A2
Dividing: (/ is used as a division sign)
= A1/ A2
Functions
Aside from simple formulas, Excel has many built in functions that can help make data analysis much easier. When using functions, Excel has made it very easy and helps to visualize what is needed in the function. Below are some commonly-used functions.
SUM Function
This is a quick and easy way to add up a range of numbers. A little tip for selecting a range is to use a colon instead of individually listing out all the cells.
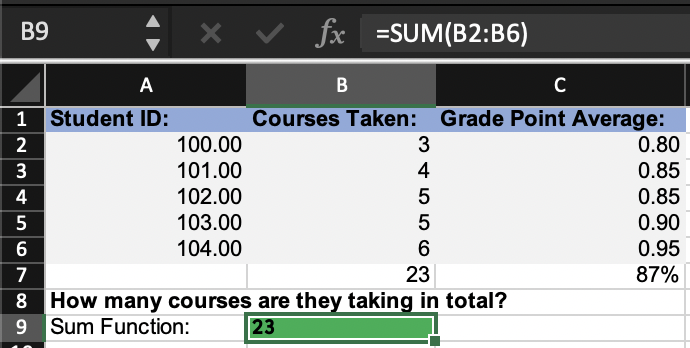
Formula structure: ‘‘=SUM(number1, [number2], [number3]...)’ OR ‘=SUM(number1:number3)’.
AVERAGE Function
Similarly, if you want to find the mean of a range of numbers, the AVERAGE function can be used.
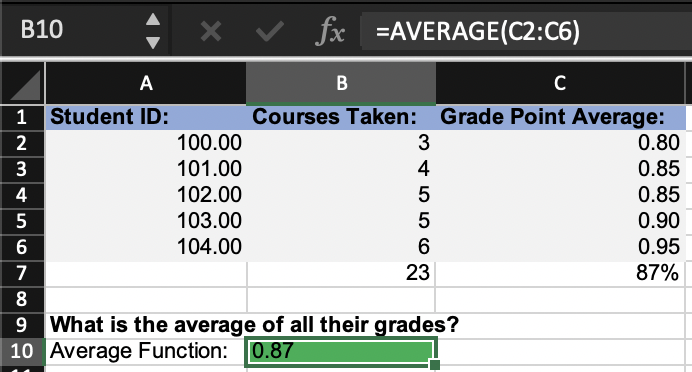
Formula structure: ‘=AVERAGE(number1, [number2], ...)’ OR ‘=AVERAGE(number1:number2)’
COUNT Function
The count function does not actually calculate data but can be useful when you need to count the number of rows that have data in them.

Formula structure: ‘=COUNT(value1, [value2], ...)’ OR ‘=COUNT(value1:value2)’
IF Statement
The IF statement will return a value if a condition is TRUE and another if the condition is FALSE. A basic returned value would be true or false, however, if you want Excel to return a specific word, then you would need to use quotations around the word. This way, Excel knows to look for characters and not a numerical value.

Formula structure: ‘=IF(logical_test, [value_if_true],[value_if_false])’
Logical test: what it is you are testing
COUNTIF Function
The COUNTIF function is used to count cells within a certain range that meet a certain criteria or condition. For example, if you want to count how many cells contain the word “ARBUS”, then you would use the COUNTIF function.
If you are counting one variable, you would use COUNTIF and with multiple variables, you would use COUNTIFS.
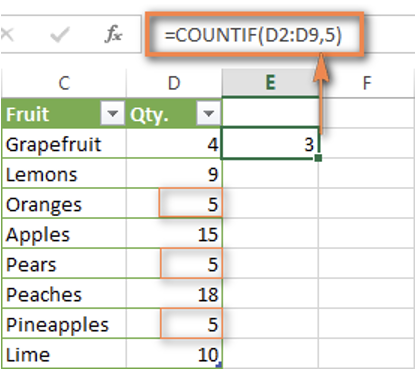
Formula structure: ‘=COUNTIFS(criteria_range1, criteria1, [criteria_range2, criteria2]...)’
VLOOKUP Function
VLOOKUP, which stands for vertical lookup, is the most powerful and often used function. It is used for performing a vertical lookup by searching for a value in the first column of a table and returning the value in the same row in the index_ number position.

Formula structure: ‘=VLOOKUP(lookup_value, table_array, col_index_num, [range_lookup])’
Lookup value: the value you are looking for
Table array: the table range
Col_index_num: The column number in your table range that contains the return value
Range lookup: Optional. FALSE, to find an exact match. TRUE, to find an approximate match. TRUE is the default value if this parameter is omitted
Pivot Table
A pivot table is a program tool that can be helpful in re-organizing and summarizing selected rows and columns of data in spreadsheets to obtain your desired report. They are a good way to organize big sets of data.
Helpful Tips
It is important to double check your work, whether it be your formulas or results. Forgetting to put a comma or bracket can create syntax errors or generate wrong results, therefore, it is important to always double check.
If you are ever feeling stuck, take breaks and break down your process step by step. Do not be afraid to make mistakes or reach out for help, managers and supervisors can be very resourceful.
Lastly, Google will always be there for you so do not hesitate to make a quick Google search.